

From Data to Better Breathing: What UK Respiratory Metrics Matter Most in 2026?
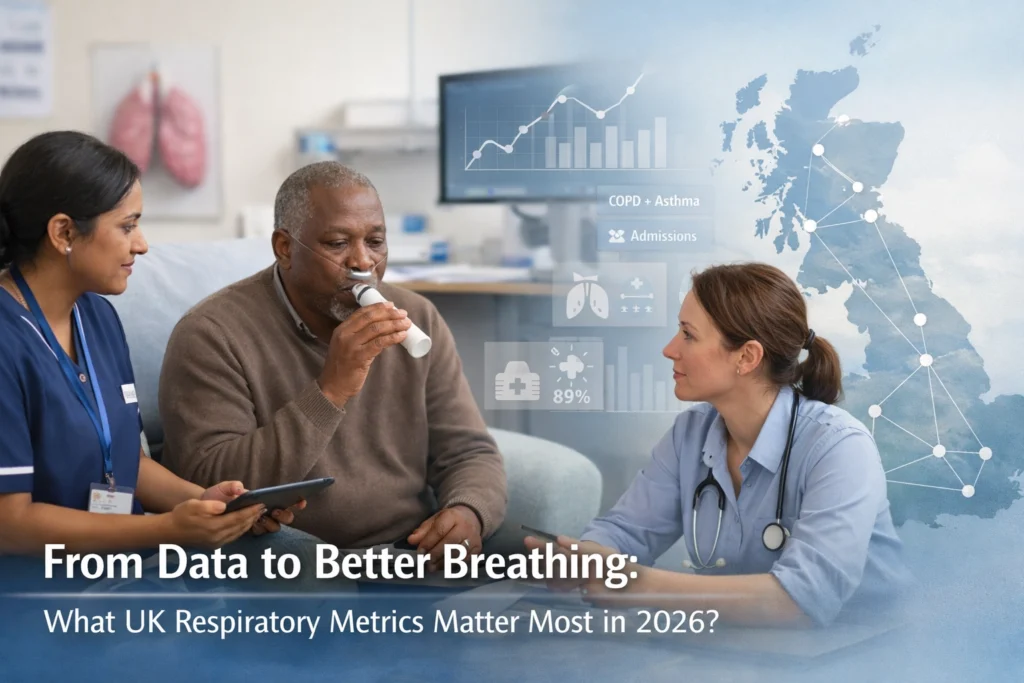
In 2026, every Integrated Care System in England is tracking respiratory data. The question is no longer whether we're measuring: it's whether we're measuring the right things, and whether those numbers are actually changing how people breathe.
For respiratory leads working across primary care, secondary care and community settings, the metrics landscape has become both richer and more complex. NHS England's Delivery Plan for Recovering Urgent and Emergency Care Services has sharpened the focus on preventing avoidable admissions. The UK Health Security Agency's respiratory surveillance reports now provide real-time insight into RSV, influenza and COVID-19 pressures. And patients are increasingly asking what their PROMs score means, not just their FEV1.
This is what's actually being used: and what makes a difference on the ground.
The Metrics That Track System Pressure
Some metrics exist to help the system respond. They don't tell you if a patient's asthma is well controlled, but they do tell you if a winter surge is building or if ICU capacity is tightening.
RSV hospitalisation rates have become a critical early warning signal, particularly for adults aged 75 and over. In week 4 of 2026, the overall admission rate sat at 2.02 per 100,000: but for those aged 85 and over, it reached 17.35 per 100,000. That's not just a statistic. It's a signal that frailty, immunosenescence and respiratory vulnerability converge in ways that demand targeted response. UKHSA surveillance data tracks this weekly, and ICSs are using it to trigger community MDT reviews and accelerate vaccination outreach.

Lower respiratory tract infection (LRTI) consultation rates in primary care fluctuate between 98 and 136 per 100,000, depending on the week and region. What matters isn't the absolute number: it's the trend. A sharp rise signals increased community burden before it hits emergency departments. GPs describe this metric as "the canary in the coalmine": it tells you when respiratory illness is spreading, often days before admissions spike.
Influenza ICU-HDU admission rates remain the gold standard for tracking severe disease impact. In week 4, the rate decreased to 0.12 per 100,000, staying within the low impact range (0.1 to 0.3 per 100,000). Respiratory physicians use this to calibrate escalation plans and ensure ventilator capacity aligns with predicted need.
ECMO admissions are the sentinel for the most critically unwell. Four cases were reported in week 4 2026. It's a small number, but each one represents a young person with severe respiratory failure requiring the most advanced life support available in the UK. Tracking this helps tertiary centres plan capacity and ensures timely transfer pathways are in place.
The Metrics That Track Disease Control
System pressure matters, but so does whether someone with COPD can walk to the shops without stopping three times.
Diagnosis rates remain foundational. NICE estimates that around 2 million people in the UK have undiagnosed COPD. In practice, that means PCNs are working through case-finding programmes using smoking history, breathlessness scores and targeted spirometry. What good looks like: a practice that knows its prevalence gap and is systematically closing it, not waiting for patients to present in crisis.
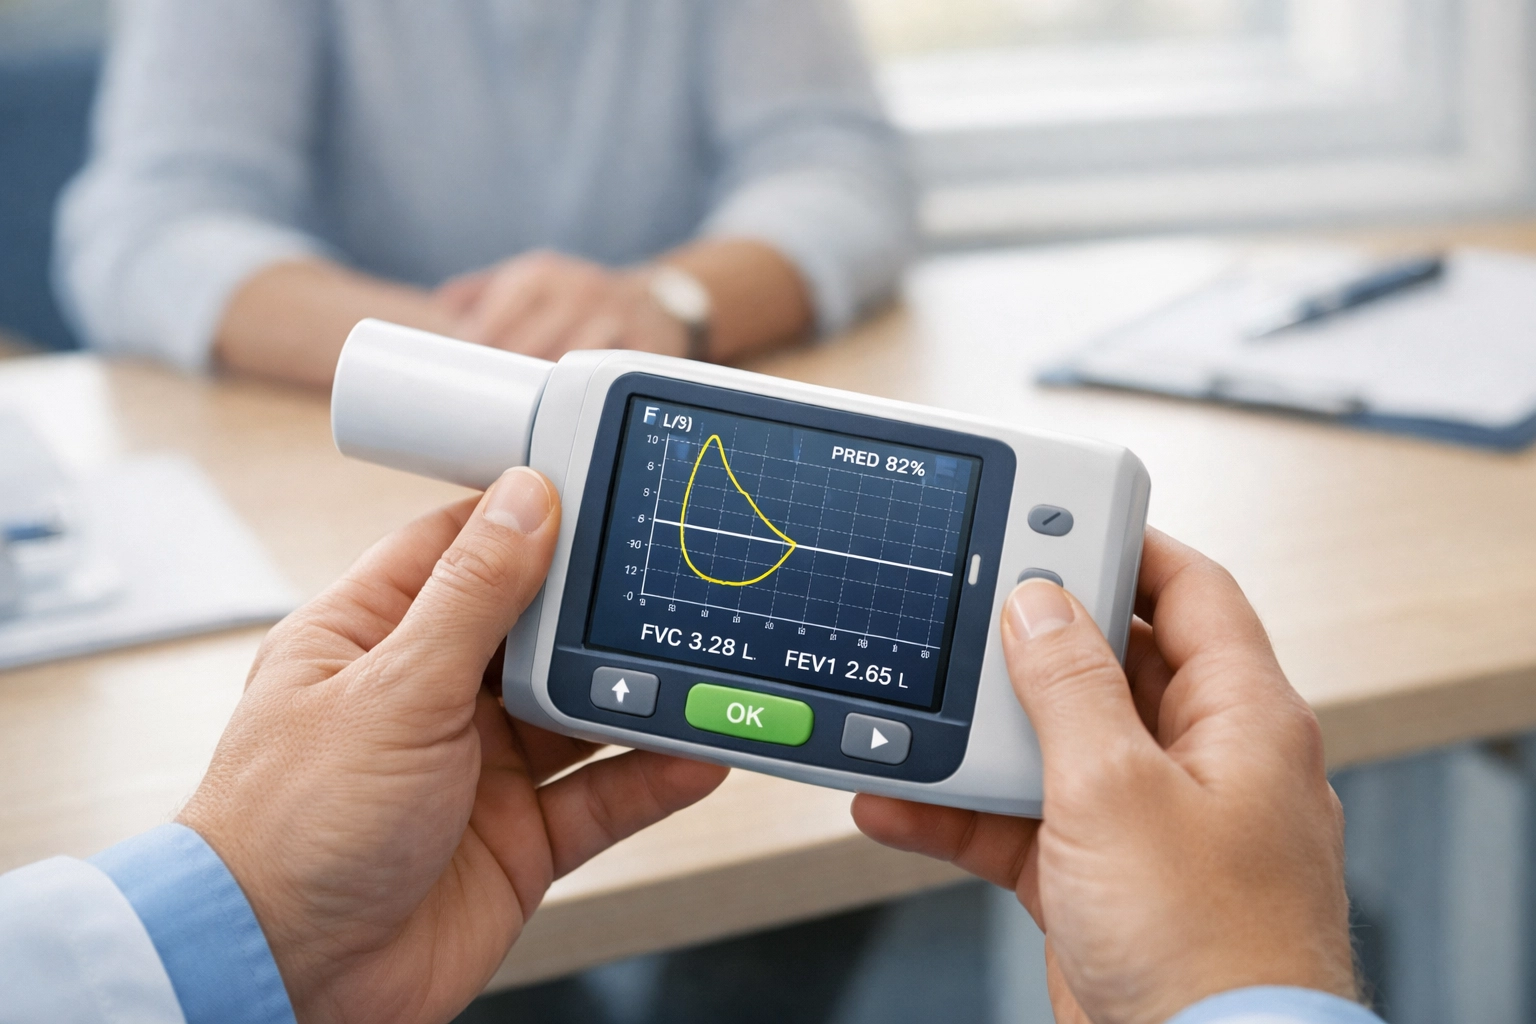
Spirometry access and quality has improved since the pandemic, but variation persists. The British Thoracic Society's Quality Standards emphasise that spirometry must be performed to ATS/ERS standards, with post-bronchodilator values and proper interpretation. Some ICSs now track "diagnostic-quality spirometry as percentage of total tests": a metric that prevents false positives and inappropriate LAMA prescriptions.
Asthma and COPD exacerbation rates tell you whether treatment is working. NHS England's RightCare respiratory pathway recommends tracking exacerbations requiring oral corticosteroids or hospital admission. The target isn't zero: it's a significant reduction year on year, alongside improved self-management and earlier intervention. One respiratory network described their ICS target as "50% reduction in repeat exacerbations within 12 months" for people with COPD.
The Metrics That Track Patient Outcomes
This is where data starts to reflect what people actually feel.
Patient-Reported Outcome Measures (PROMs) for respiratory conditions: such as the CAT score for COPD or ACQ for asthma: are being embedded in annual reviews and remote monitoring pathways. What matters isn't the score in isolation; it's whether it's being acted on. A CAT score of 28 should trigger an urgent MDT discussion, not sit unread in a clinical system.
Mortality rates for asthma and COPD remain sobering. The National Review of Asthma Deaths (NRAD) found that two-thirds of asthma deaths were preventable. Tracking this at ICS level: alongside root cause analysis and learning: turns tragedy into system change.
Emergency admissions and readmissions within 30 days measure whether discharge planning and community support are working. NHS England's Ambulatory Emergency Care guidance encourages alternatives to admission, but only if safe pathways exist. The metric to watch: percentage of COPD exacerbations managed in AEC or virtual wards, with clinical outcomes that match or exceed traditional admission.
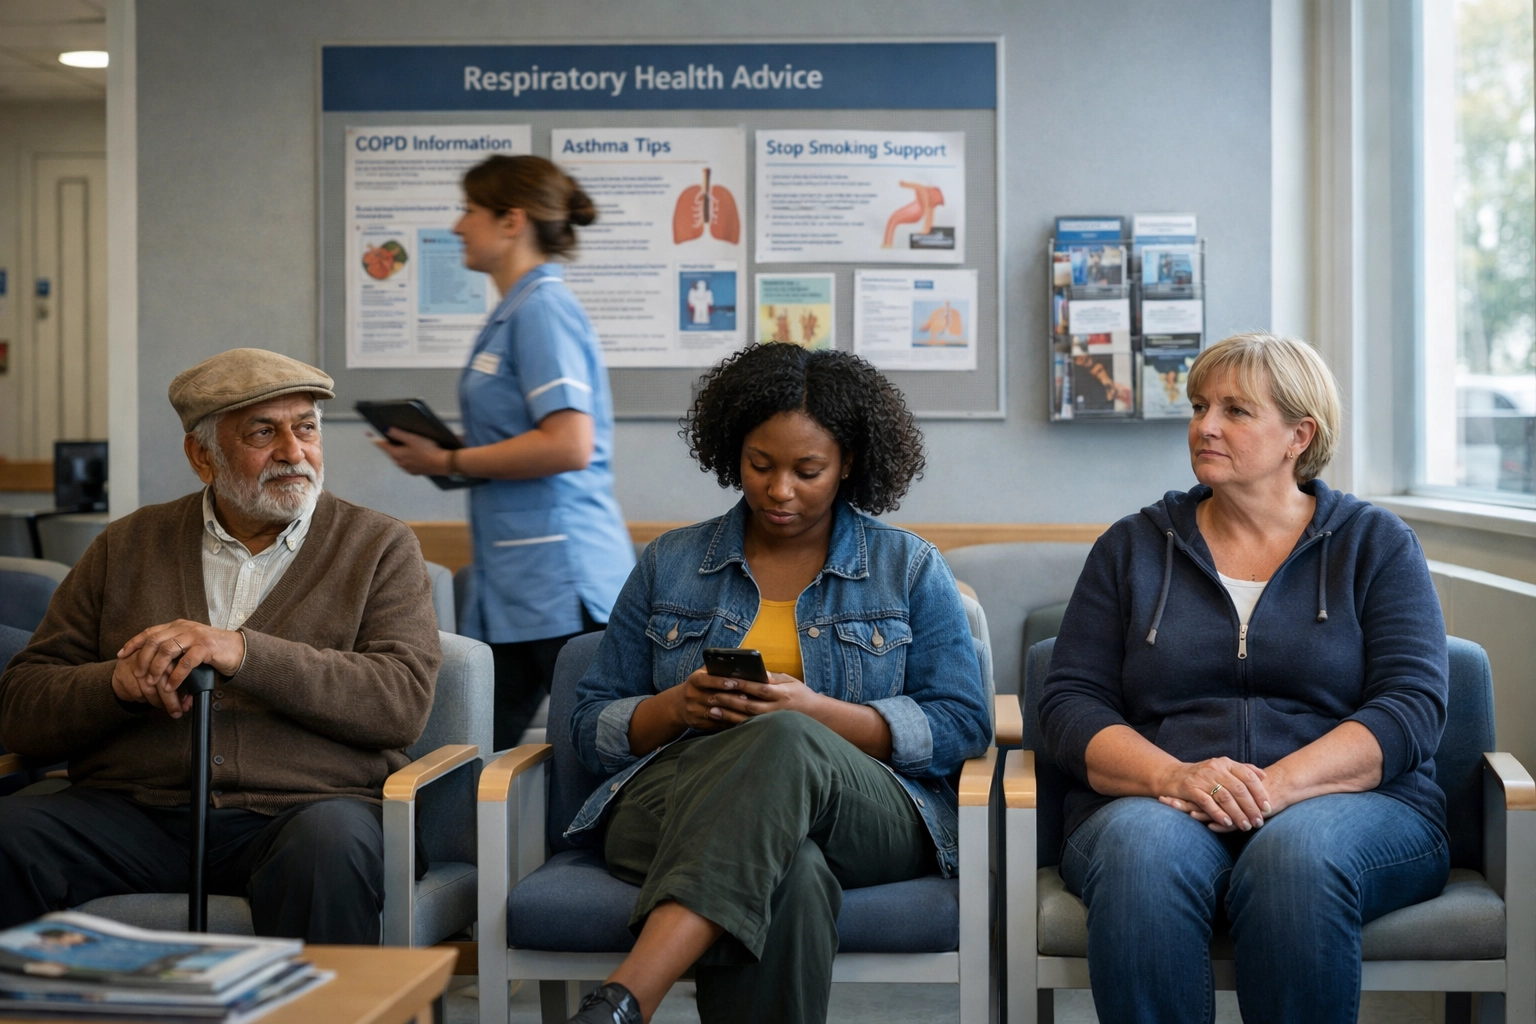
The Metrics That Track Inequalities
Averages hide everything that matters.
Diagnosis and treatment rates stratified by deprivation quintile, ethnicity and geography reveal where the system is failing. The Office for Health Improvement and Disparities (OHID) Fingertips tool makes this data accessible at ICS and local authority level. Some areas are now tracking "diagnosis gap by IMD decile": recognising that people in the most deprived areas are more likely to have COPD, less likely to be diagnosed early, and less likely to receive optimal treatment.
Smoking prevalence and quit rates sit upstream of almost every respiratory outcome. NHS Digital's annual statistics show smoking rates remain highest in routine and manual occupations. What good looks like: an ICS that integrates smoking cessation into every respiratory pathway, with opt-out referrals to stop smoking services and pharmacotherapy support embedded in annual reviews.
Vaccination coverage for flu, COVID-19 and (where eligible) RSV and pneumococcal disease protects the most vulnerable. UKHSA publishes weekly uptake data, and variation between ICSs is significant. Closing that gap requires outreach, not just invitations.
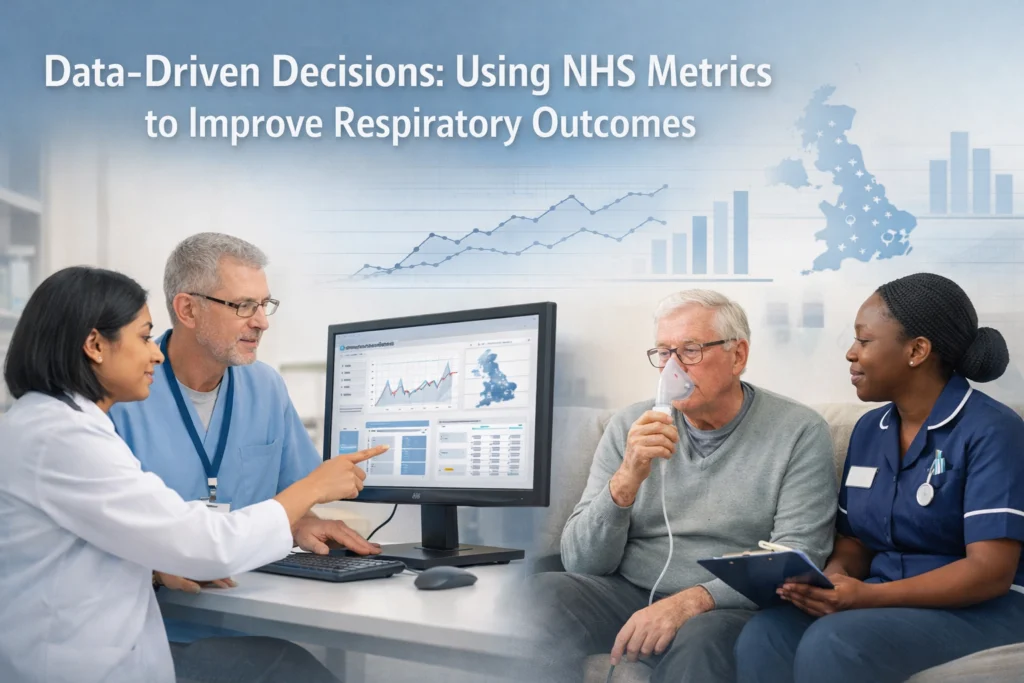
What Good Looks Like: Using Metrics Across ICSs
The most effective ICSs don't just collect data: they use it to drive collaborative action.
Shared dashboards that combine primary, secondary and community data allow respiratory networks to see the whole picture. One London ICS described their approach as "same data, same day, same conversation": ensuring clinical leads, commissioners and service providers are working from a single version of the truth.
Variation analysis identifies outliers and spreads best practice. If one PCN has spirometry diagnostic rates twice the ICS average, the question is: what are they doing differently, and how can it be replicated?
Population segmentation allows targeted interventions. Instead of blanket campaigns, ICSs are using data to identify "high risk, low engagement" cohorts: people with poorly controlled asthma who haven't had a review in 18 months, for example: and designing wraparound support.
Feedback loops to frontline teams ensure metrics inform care, not just governance. Monthly scorecards mean nothing if practice nurses don't understand what's being measured or why it matters. The best systems invest in data literacy and celebrate improvement.
From Numbers to Better Breathing
Metrics matter because they make the invisible visible. They tell us who's falling through gaps, where capacity is stretched, and whether the changes we're making are actually working.
But data only improves outcomes if it leads to action. That means clinical leads who can interpret trends, commissioners who fund based on need, and frontline teams who have the time and tools to respond.
In 2026, we're not short of respiratory data. We're learning how to use it better.
Want to be part of the conversation shaping how respiratory data is used across the UK? Join us at The Respiratory Network Round Table 2026, where NHS leads, patient advocates and Life Sciences partners come together to tackle the metrics: and the reality behind them.

Responses